/ Smart manufacturing / In control / Monitor and control
Measuring all order activities provides a wealth of information that serves as input for the continuous improvement process. This gives you insight into the added value, downtime, productivity and pre-calculation/post-calculation and much more.


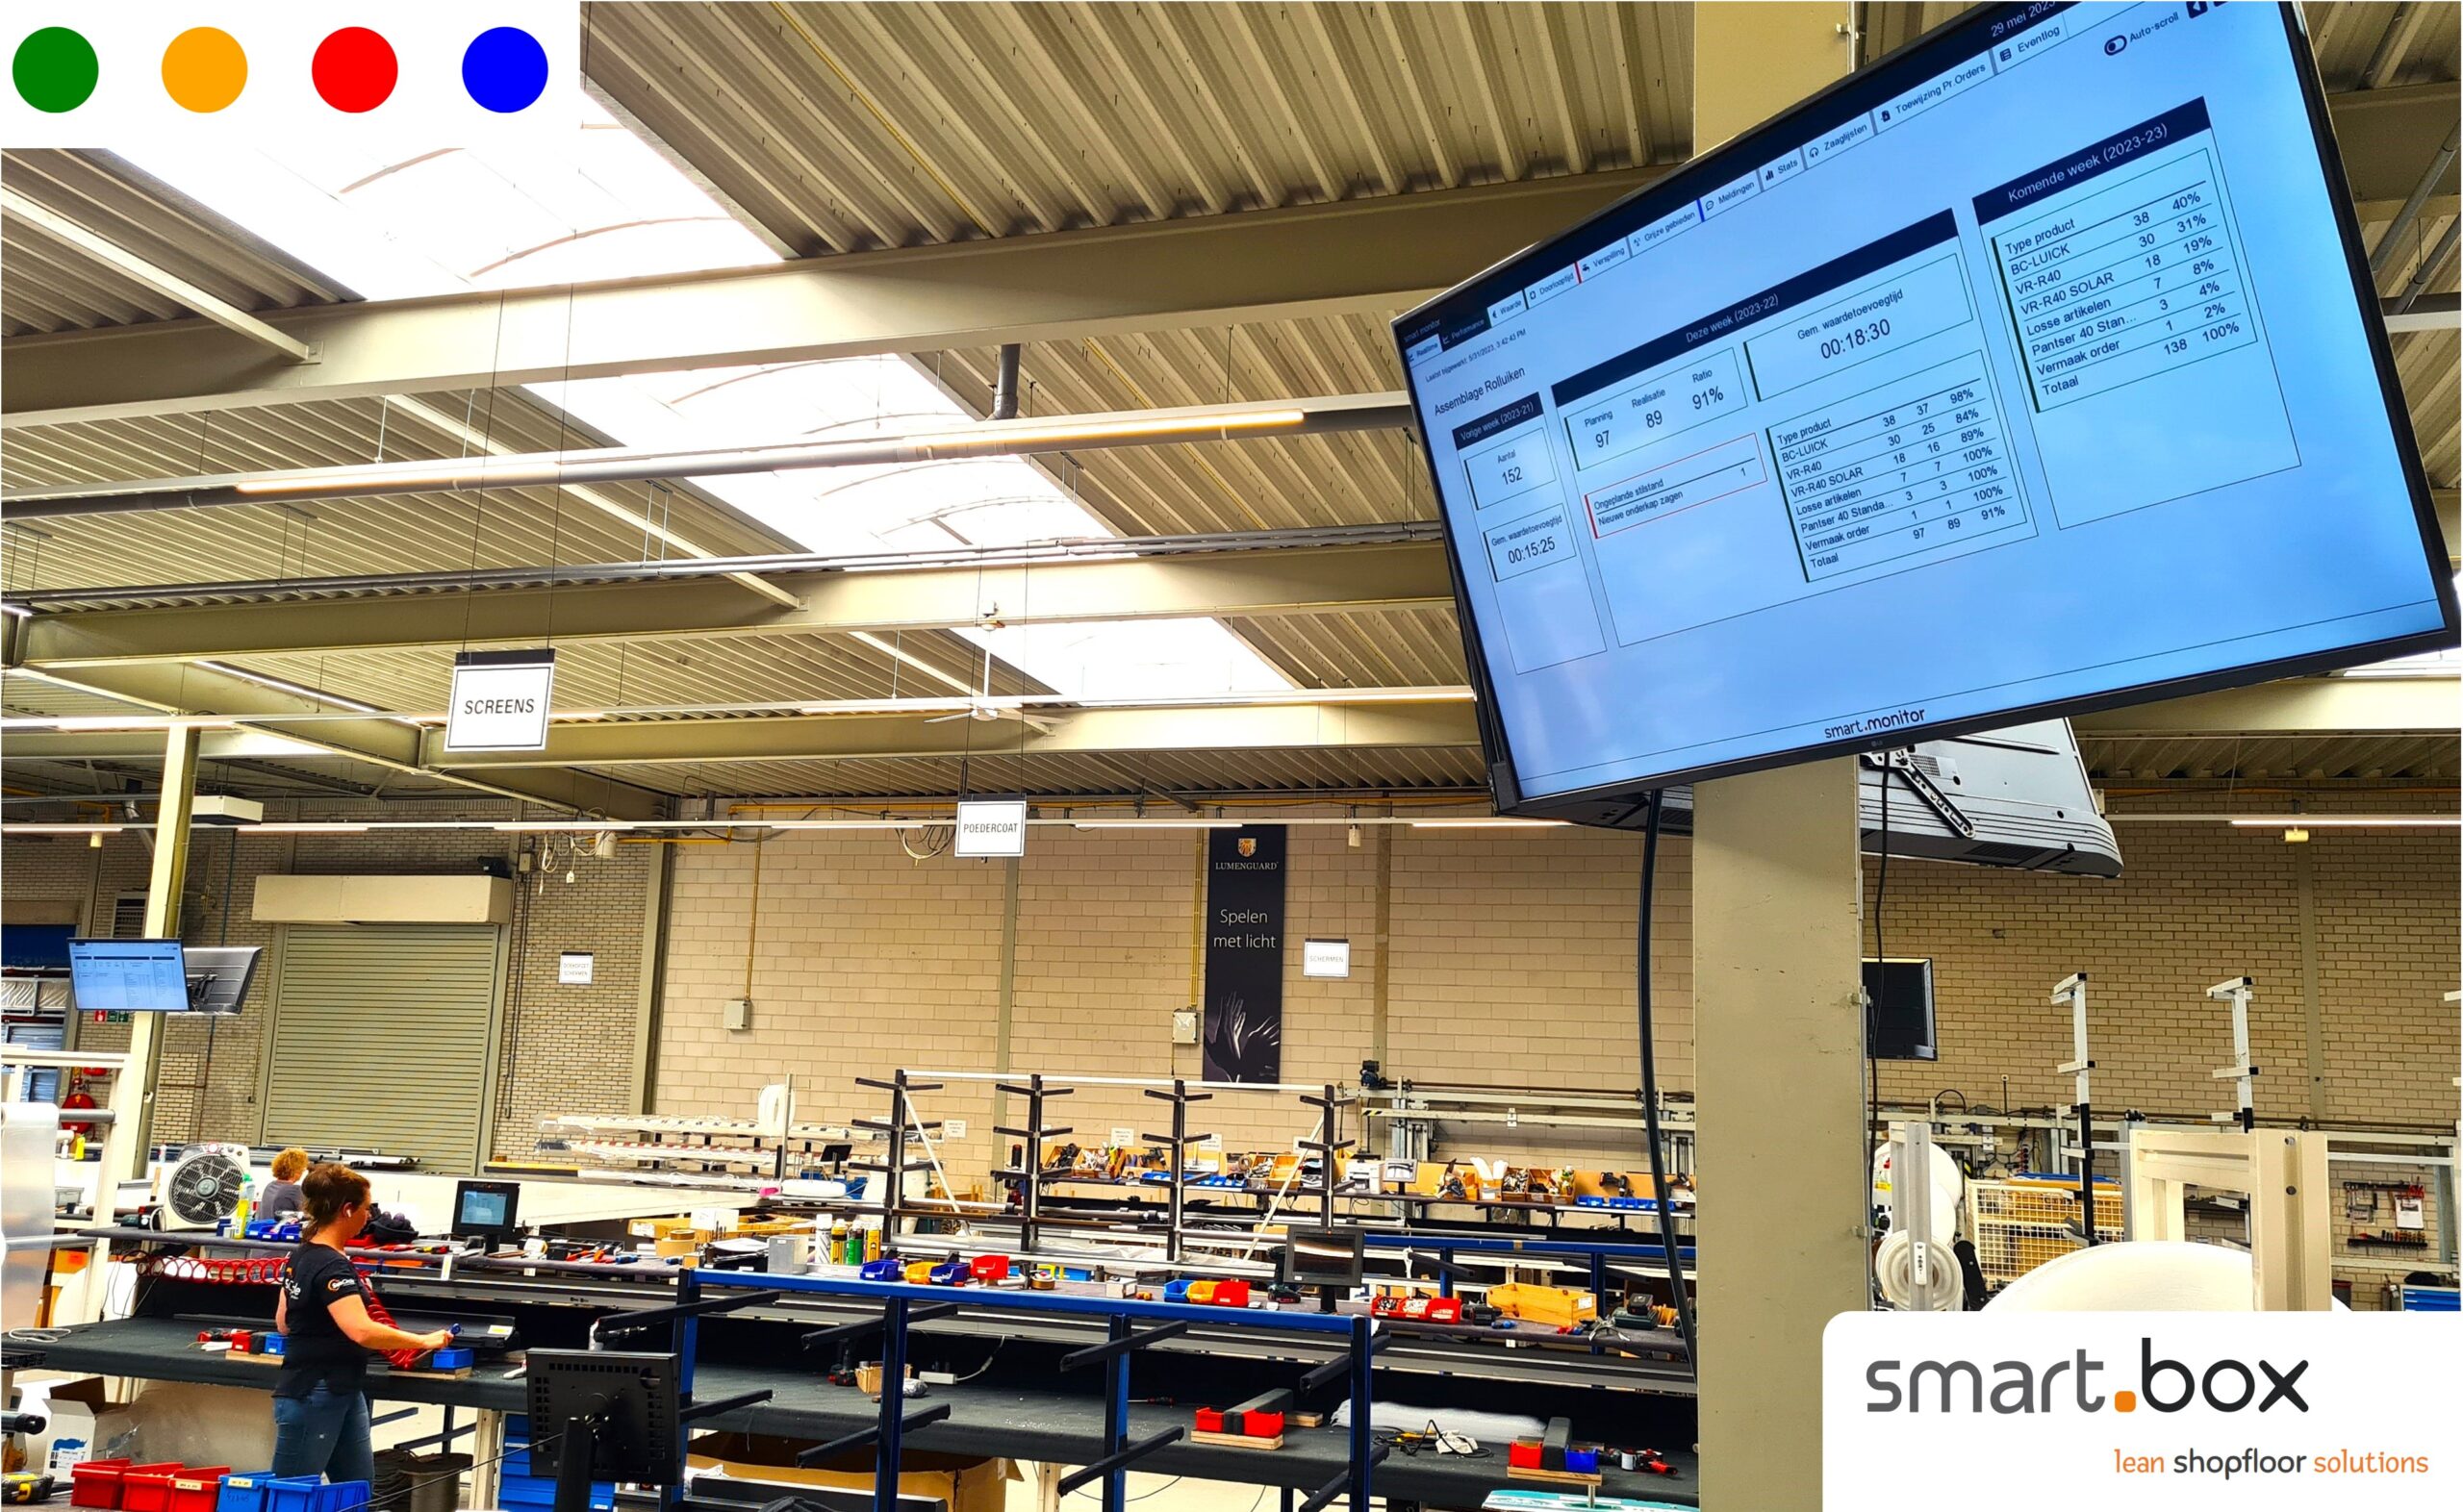
By displaying both planning and actual performance, you engage all employees in the daily operations. This information is shown on large screens in each department, as well as in support areas.
Each live dashboard provides relevant data specific to the department. For example, in a job shop environment, it displays this week’s planning and actual performance, along with next week’s schedule. In machine environments, we show machine status, performance, and all order details. In assembly processes, the focus is on performance relative to customer takt. For project-based organizations, the dashboard highlights the status of ongoing projects.
Naturally, you want to pinpoint where improvements can be made in the process and then track the impact of those changes. With the smart.monitor, you can visualize all activities and quickly identify bottlenecks. Pareto charts highlight the most significant planned and unplanned downtimes, whether by sub processes or the entire value stream. Additionally, the impact of improvement actions can be easily tracked through trend graphs.
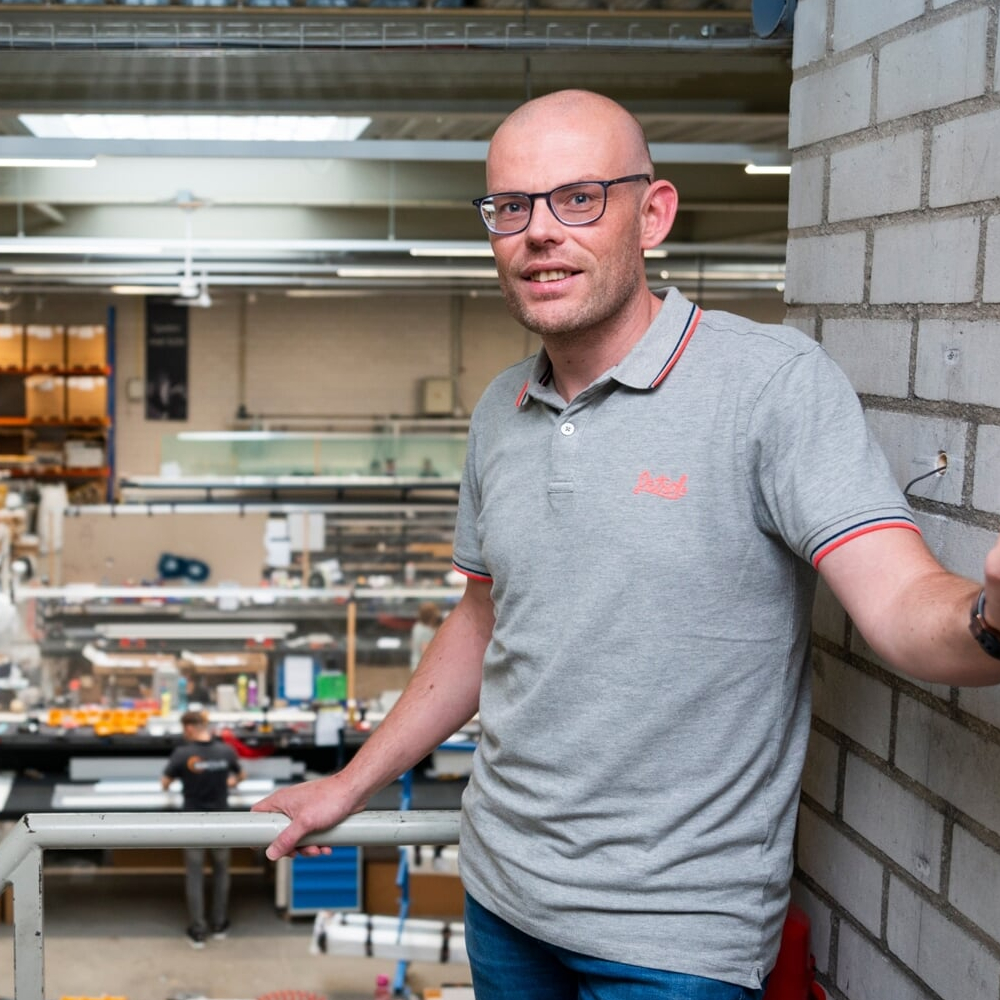
“Employees gain insight and control over their own planning & realization.”

Jaap Koster
Operations Manager – SunCircle

The ideal solution for tracking production performance is through live monitors on the shop floor. SunCircle sought greater visibility, which is why department performance is now displayed in every department. During department walks, the production status is instantly visible, enabling the right questions to be asked to further optimize the order flow.
What makes the smart monitor from smart.box unique is that it not only provides insight into planning and execution, but also displays real-time order downtime (🔴 + 🟡). These can be addressed directly on the shop floor or by supporting departments. Additionally, logging stoppages offers valuable data that can drive long-term improvements.

Working Digitally
Every employee always receives only the correct order information in a user-friendly way.
Monitor and control
You want to monitor daily operations and make immediate adjustments as needed.
Transparency in the office
Gain insight into how much your support and service departments can contribute to value-added activities.
Workload planning
A reliable output starts with the right input. Seek a smart solution that can continuously monitor and (re)schedule 1000+ orders.
Data-driven stand-up meeting
Always up-to-date operational data for Safety, Quality, Delivery, Cost and People (SQDCP).
What you measure, you know
Let's integrate all production and logistics resources to enhance the order flow.
Pull planning
Prevent overproduction and high WIP in assembly and job shop environment.
Assembly
Prevent overproduction and high WIP in assembly and job shop environment.
Zero mistakes
Let’s optimize processes in a way that continuously minimizes the chance of errors
OEE measurement
Maximizing machine productivity starts with understanding the biggest disruptions and downtime.
Collaboration between human and machine
Let's integrate all production and logistics resources to streamline and enhance the order flow.

